Use Screener Tab data to develop your own Strategy
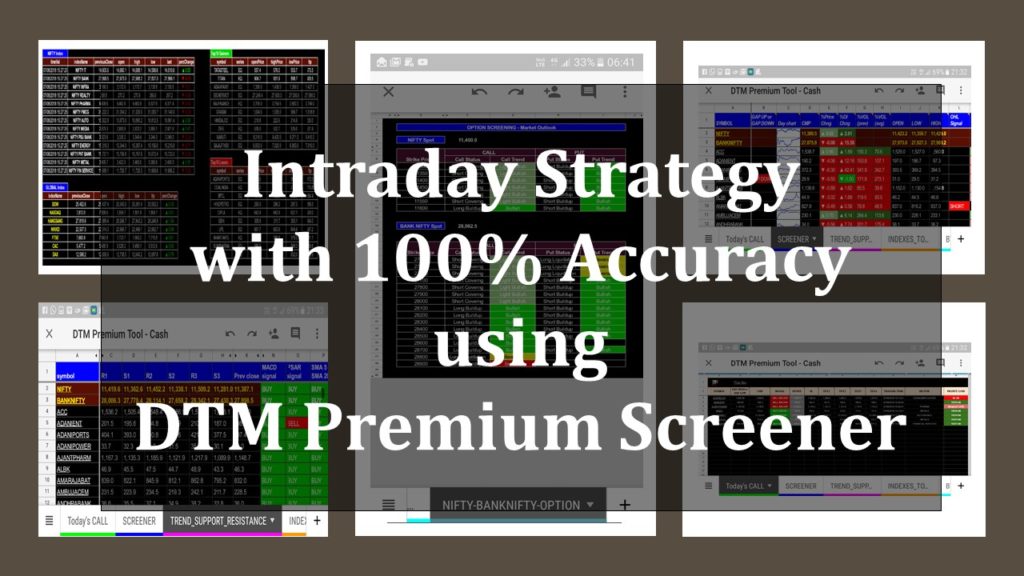
In this Blog we shall explain how can you use different data points present in our Screener and plan your strategies based on those data.
Intraday trading is all about price breakout, we need to understand the breakout price and plan our entry accordingly.
OPENING RANGE BREAKOUTS
Opening Range Breakout (ORB) is very simple and well known intraday strategy. Where ORB generally gets calculated based on the first 1 hour trading history of the day, either to buy or sell. ORB gets recorded on long side considering the highest price reached or short side with the lowest price reached during the first 1 hour.
Traders generally takes the trade in same direction of the breakout either to BUY or for SALE.
PREVIOUS-DAY RANGE BREAKOUTS
Previous day Range Breakout (PRB) is considered based on the Previous day’s High and Low prices of any stock.
When price goes above previous day’s high, that indicates stock is still undervalued and buyers are entering at that level. On the contrary, if the price falls below previous days low, that indicates the stock is still over priced and shall move further down.
Trades generally takes trade in the same direction at which the current day price breaks out from Previous Day’s range in either (Long or Short) direction.
PERCENTAGE CHANGE IN VOLUME & OPEN INTEREST
Volume is most important indicator for intraday trading, if any stocks moves up or down with high volume, that is an indicator of the same directional move of the stock for that day. If any stock moves up and breaks either PRB or ORB with high volume, that is an indicator of further same directional move.
The same logic is applicable for change in percentage of Open Interest too.
PERCENTAGE CHANGE IN PRICE
Change in price action is the essence of Stocks, if any stock moves up or down with high volume, then considering change in percentage of price trader can take a decision, weather to consider further up move or further down move of the stock. While taking the decision trader need to consider ORB and PRB signals too.
SUPPORT & RESISTANCE
Pivot Support and Resistance levels are based on previous day’s High, Low and Close prices. Price moves above or below these levels signifies strength and weakness respectively.
THREE DAY PRICE ACTION
This indicator considers last 3 days price action movement and compares the closing prices of last 3 days, if the price action moved up or down in last 3 days, there is a chance for the stock to continue the trend.
Intraday traders need to take protective decision based on the last 3 days price change. If the stock price reaches overbought area then trader should not take intraday long position as a precautionary measure, similarly if the stock reaches oversold area then trader should not take short position.
If you do not want to plan your strategy or don’t know how to plan a strategy or do not have time to keep an eye on to the trading terminal throughout the day, then we have a solution for you.
INTRADAY SCRIPT SCREENING:
In this feature our Algo based tool screenes potential Scripts/Stocks automatically for trade and provides you with Entry, exit and Stoploss levels. You need to follow the levels and and place your Limit Bracket order accordingly.
BTST & STBT:
Our Algo based tool also screns BTST and STBT calls based on some pre defined criteria, so that any traders can plan their trade accordingly. This screenig is based on Volume change and Price change comparing entire day vs last 45 minutes of trade data.
