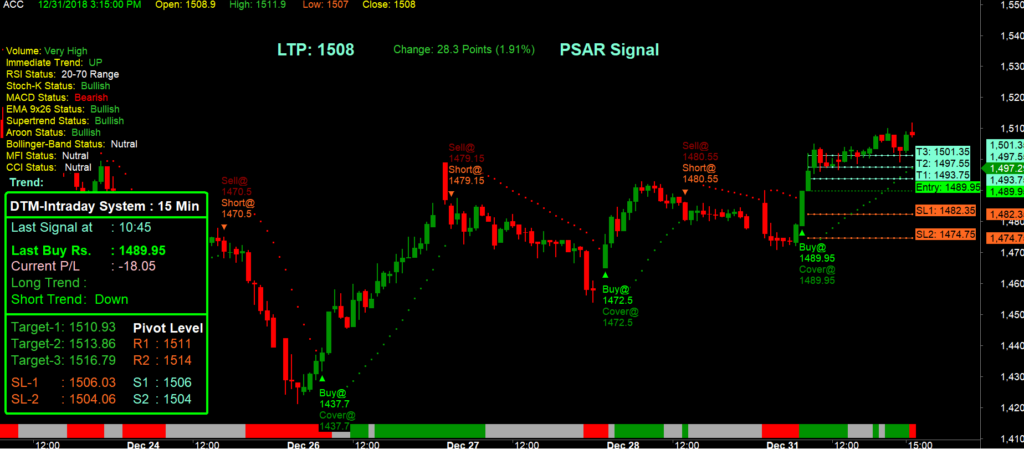
PSAR or Parabolic SAR is an indicator to identify the trend and reversal. This indicator is plotted as a dot either above the Stock price or below it. SAR signifies Stop and Reverse, hence the PSAR dots continue to follow the trend and at potential reversal it changes its direction.
PSAR dots follows the price chart below the candles when an uptrend continues, and these dots reverses and gers plotted above the price chart when the downtrend continues.
PSAR is one of the great indicator for a trader to identify the trend and reversal, as it follows trailing stoploss method.
In the above image you shall find Green and RED dots, which indicates Uptrend and Downtrend respectively. You can also find the Buy and Sell signals in all potential reversals. These automated signals can help trader to place orders based on the trend.
In Amibroker there is a default function to calculate SAR, we need to use this function to plot PSAR in our Algo, please find below the complete PSAR AFL for your reference. You don’t need to know the internal calculation on how to develop SAR, however if you are interested you can go to this link to know further detailed calculation.


