What is a Renko Chart
Renko is a chart type, developed by the Japan. The concept of Renko came from Brick in Japanese, which gets constructed on price movement. The chart looks like a series of bricks, look below. Renko brick can be of different fixed sizes, depends on trader’s need. A new brick is created when the price moves up or down to that brick size price amount. Each block is positioned at a 45-degree angle (up or down) to the prior brick. An up brick (Uptrend) is typically colored green, and a down brick (Downtrend) is typically colored black or red.
In renko chart there is always a fixed brick size. in candlestick, the candle size varies based on price movement, but in Renko, the brick size doesn’t vary, it is predefined and fixed, if price moves one direction in multiple of brick size, then multiple brick shall form.
Secondly each brick formation time varies based on price movement whereas a single candlestick is always takes same time to form. Hence Renko is not time dependent and candlestick chart is time dependent. In the below image we can see how RENKO brick formation differs from traditional candlestick chart formation. Where in 25 minutes One RENKO brick is still forming but Six 5Min Candlestick got formed.
Backtesting on RENKO is not a good idea as this is not dependent on time, similarly as bricks are of same size and forms with different duration of time, its always advisable to trade using Tick data for RENKO chart if a trader is trading using Auto trade. Failing which repainting of signal might cause erroneous trading. In the similar line higher timeframe RENKO chart is again an illusion which many traders don’t realize and the chart looks fascinating where it looks as no loss strategy. But as the chart is of higher timeframe, there is higher possibility of false brick formation and missing trading signals.
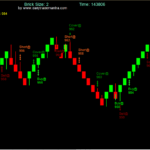
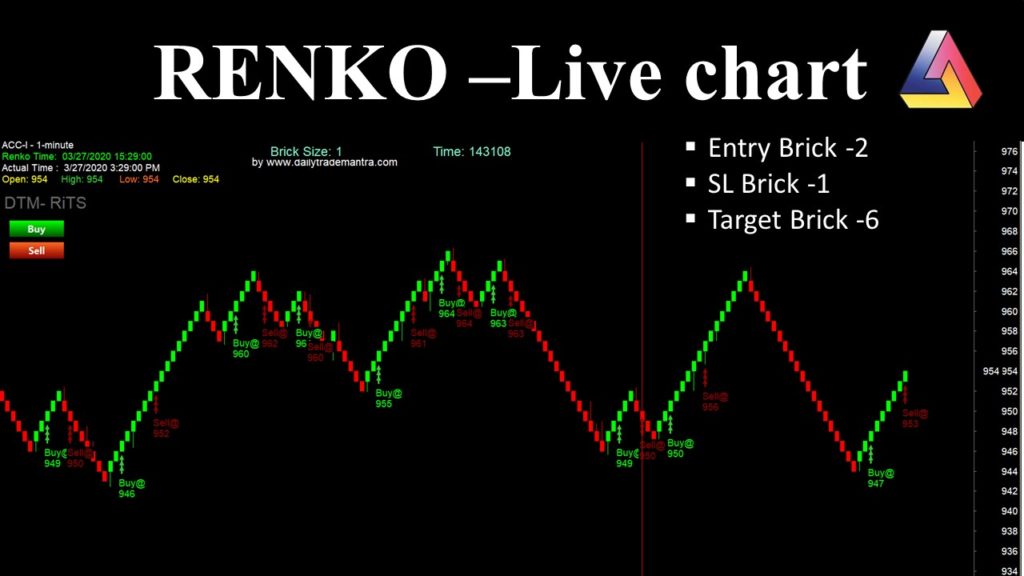
The below image shows a Renko chart of Brick size 1 (Not advisable, just for display)
Please check our fully automated RENKO System to get an idea how RENKO system works.
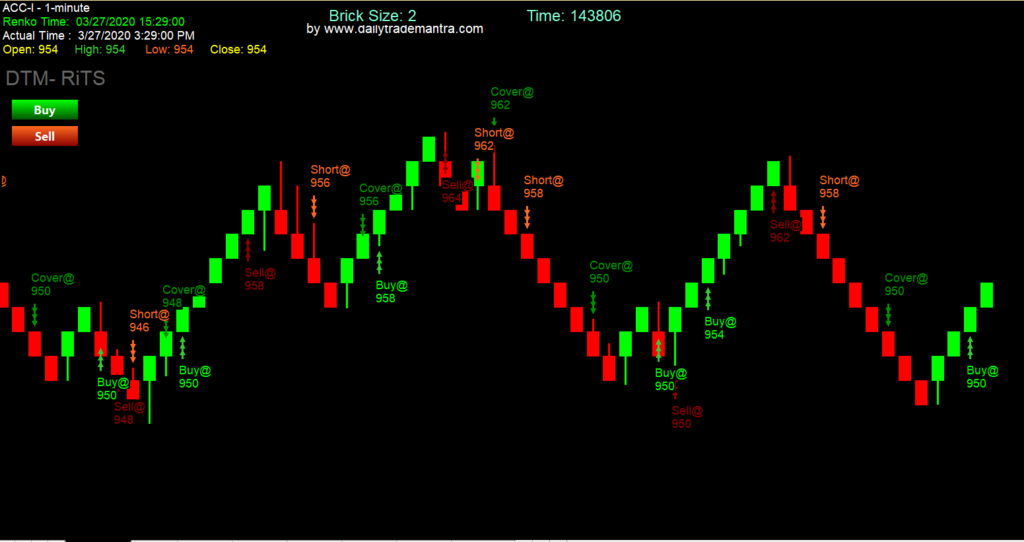
How to read a Renko chart
Renko chart helps trader to eliminate noise or sideways movement of any Script, as the brick gets built only if the price moves up or down by the Brick size fro the top or bottom of the last brick. Is this sounding confusing, let me explain in further detail from the above image.
In the image above, the last closed price of ACC is Rs. 946 and the Brick size is Rs. 1. There can be two chances for the next brick formation. 1st, the next brick can be a up Green brick or down Red brick. To create an up brick, the price have to move up to Rs. 947 (i.e. 1 Rs up from last closed price) or to create a Red down brick, the price need to move down to Rs. 944 (Rs 2 down from last bricks closed price, as last brick is a Green brick).
Please do remember to get a new brick formation in the chart price need to move Rs 1 up from last bricks closed price (in case last brick is Green brick) or Rs 2 up from last bricks closed price (if last brick is red brick) and visa versa for Red brick formation.
Benefits of using RENKO chart
Renko eliminates high, low or open prices. Consider Reno chart as candle of closed prices, as Renko chart is not dependent on time. Time can keep moving but Renko can remain unchanged without any brick movement if the close price has not crossed the brick size as mentioned above. This charting pattern gives trader an edge as Renko eliminates to create any new brick for small price movement according to its brick size.
In case Trader want to capture price volatility then choose small brick size, if trader want stable price movement then choose long brick size. Brick size can start as small as 0.001 to 10 or more based o the the underlying Stock price. If the Stock price is more then trader need to consider big brick size, if Stock price is less then Brick size should be low. There are different approaches to trade using Renko chart.
How to Trade using RENKO: To trade using renko, the main challenge is setting up the Brick size. If you can choose the right brick size then you can won the game. Choosing Brick size shall depend on the script price, its volume of trade and volatility. My suggested Brick size is 0.2% for scripts and Indexes and 2% for Option trade.
You can choose renko brick size on % of the script price, or fixed brick size based on your analysis. You can also use ATR(14) range if you want a variable brick size. But ATR based RENKO chart is repaint able as the price varies with each close price and ATR varies accordingly.
Check our RENKO Trading system which is fully automated, developed using Amibroker AFL language and runs on Tick data.