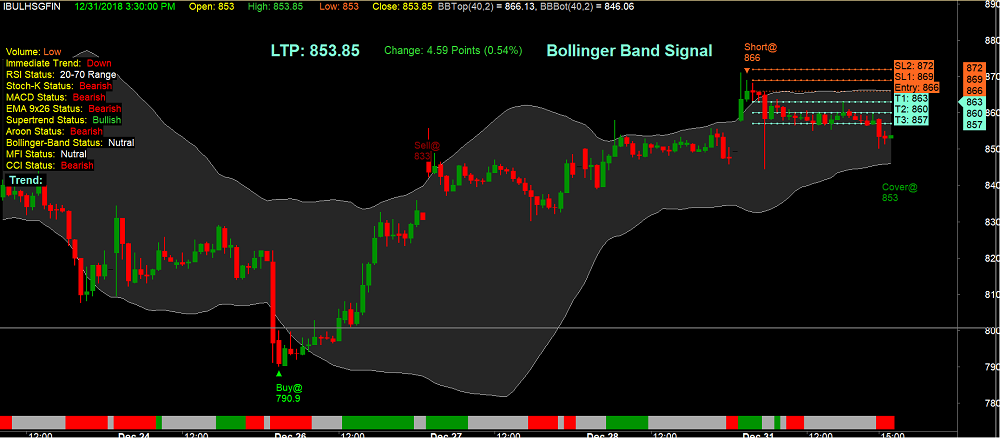
Bollinger Band or B-Band - How to trade with B-Band
Bollinger Band is a technique which generally signifies the overbought and oversold areas to a Trader. When the Price reaches lower Band, it generally signifies the oversold area and good opportunity for going Long. And when price reaches above Upper Band, it signifies the price have reached the overbought area.
Bollinger Bands are plotted with moving average where two trading bands are plotted above and below it like a channel. The Channel gets created by the standard deviations of the stock. The Bands expands and contracts based on the volatility of the Stock. Volatility is measured by Standard Deviation. When the bands come close together, constricting the moving average, it is called a squeeze. When two bands squeeze that signals low volatility and is considered to be a sign of future increased volatility and possible trading opportunities. Whereas more wide the two bands moves indicates low volatility in future and can be considered as exit from existing trade.
When the price is moving up, then the Price shall remain in the Upper band or go above that. While continuing the uptrend if the price fall and touches the Middle Moving Average line then that may signal a trend reversal.Whereas in downtrend, when the price crosses lower Band and also crosses the Middle Moving average line that can be considered as trend reversal toward bull trend.
In Amibroker there is a function using which we can plot Bollinger Band, there is no need to know the detailed calculation. Below is the sample AFL to plot Bollinger Band respective to any Stock.