
Candlestick is a basic measurement scale of any stock’s price movement. A candle forms based on a stock’s open, low, high and close price for a specific period. The period can be of 1 min, 2 min, 3 min, 5 min, 10 min, 15 min, 30 min, or may be 1 day, 1 week, 1 month etc.
Based on the type of trading plan any trader has, they can choose any type of candlestick for analysis or setting their strategy.
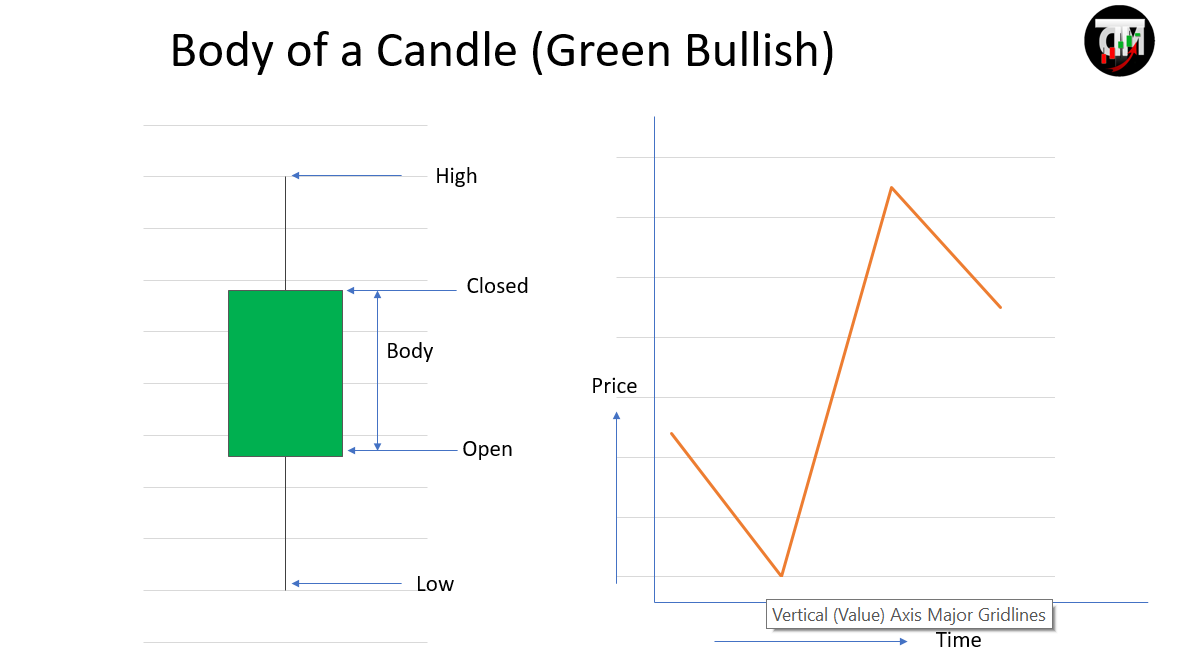
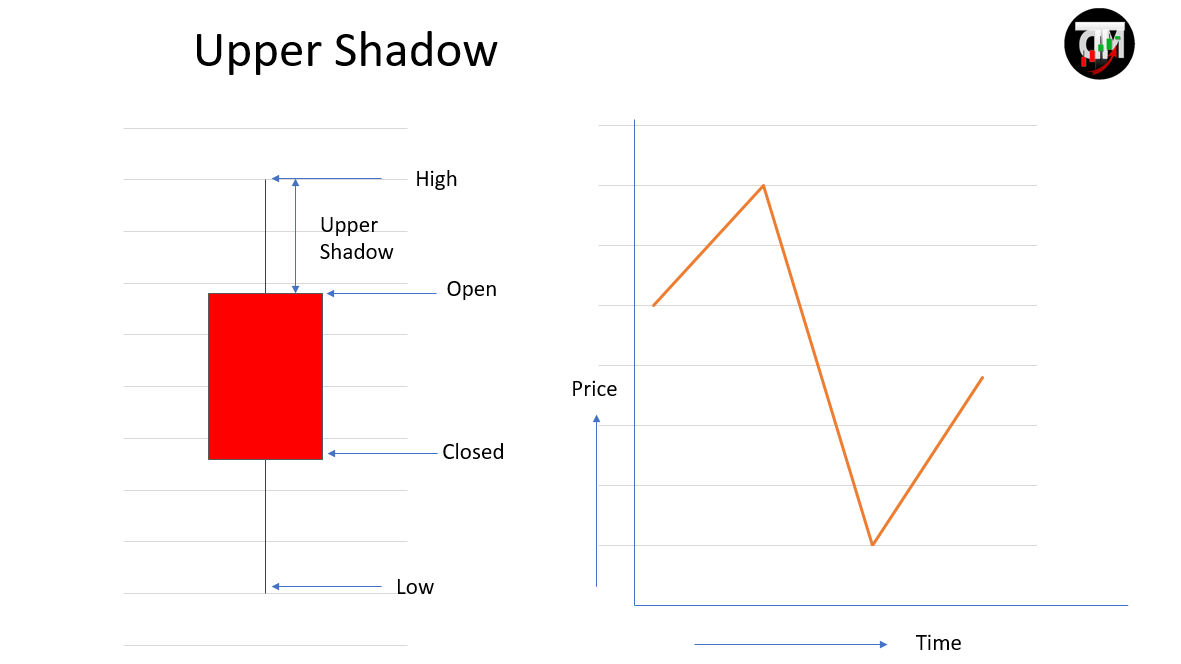
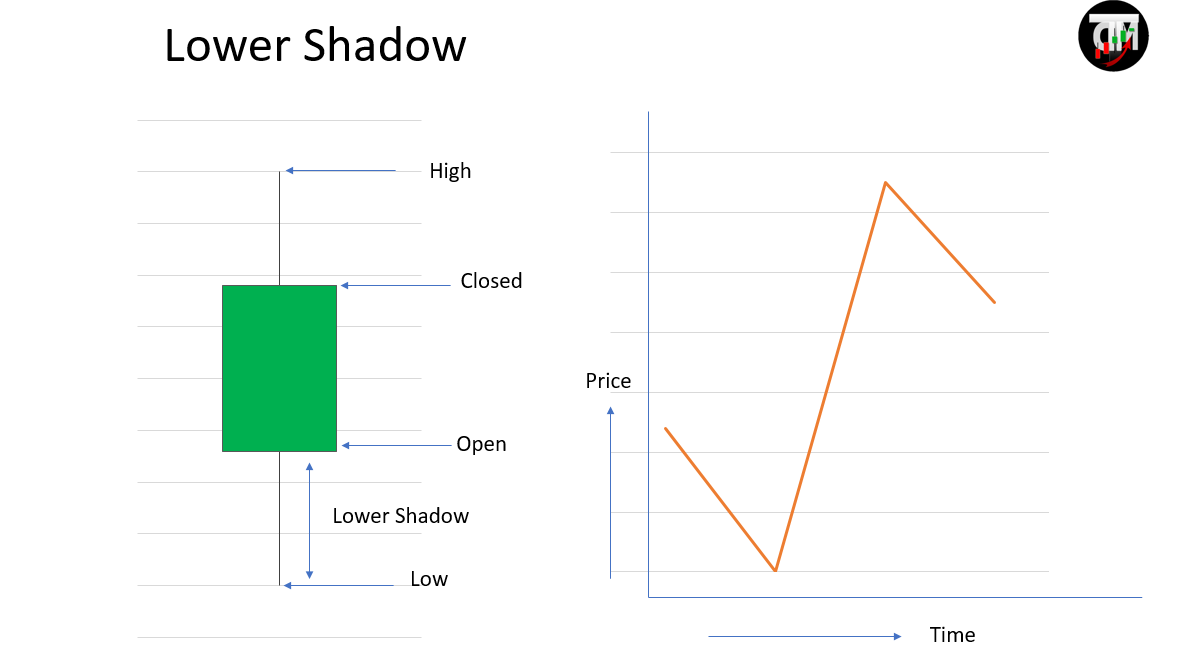
A candlestick has a start or open price, a low price, a high price and a close price for a specific period as mentioned above, hence it gives a holistic view of any stock as it moves along during a trading day.
If any stock moves up (Bullish) then candlestick become green as its closed price is greater then its open price
If any stock moves down (bearish) then the candlestick becomes red as its close price is below its open price.
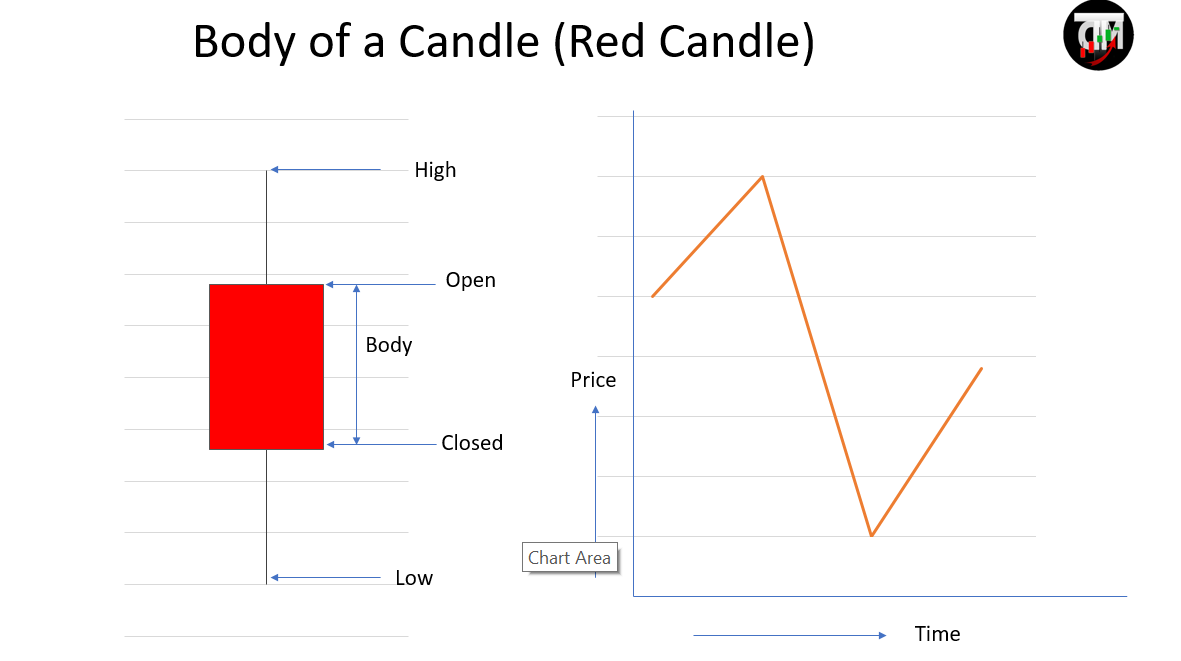
The body of any candle shows stocks close and open price for a duration.
Lower shadow signifies the lowest point from its open (Bull candle) or close (bearish candle) price, similarly upper shadow signifies the highest point from its Close (Bull candle) or Open (bearish candle) price.
Multiple candlestick of same time interval creates a candlestick chart of any stock. Understanding of a candlestick is a basic and absolute necessity for any intraday traders, all indicators are generally get plotted based on candlestick chart.